Symfony Stopwatch Example

Symfony Stopwatch is a component that allows you to profile and measure the duration of specific parts of your code. It's particularly useful for identifying bottlenecks and optimizing performance. Here's how you can use Symfony Stopwatch:
Stopwatch Example
use Symfony\Component\Stopwatch\Stopwatch;

$stopwatch = new Stopwatch();

$stopwatch->start('fetch_articles');

// ... fetching articles from the database
// Let's add a sleep() to mimic a slow database query
sleep(3);

$event = $stopwatch->stop('fetch_articles');
stop() returns StopwatchEvent which has the following methods:
$event->getCategory();   // returns the category the event was started in
$event->getOrigin();     // returns the event start time in milliseconds
$event->ensureStopped(); // stops all periods not already stopped
$event->getStartTime();  // returns the start time of the very first period
$event->getEndTime();    // returns the end time of the very last period
$event->getDuration();   // returns the event duration, including all periods
$event->getMemory();     // returns the max memory usage of all periods
Using $event->getDuration() you can get the execution time, for example.
Using Symfony Stopwatch with the Profiler Bundle
The Symfony Profiler Bundle (symfony/web-profiler-bundle) is a powerful debugging and profiling tool provided by the Symfony framework. It allows developers to gather detailed information about the execution of requests and responses in a Symfony application.
The Stopwatch component doesn't appear automatically in the Profiler console, but together with the LoggerInterface you can log the timings as debug.
// ..
use Psr\Log\LoggerInterface;
// ..
public function view(LoggerInterface $logger)
{
$stopwatch = new Stopwatch();
// starts event named 'eventName'
$stopwatch->start('fetch_posts');
sleep(2);
$event = $stopwatch->stop('fetch_posts');
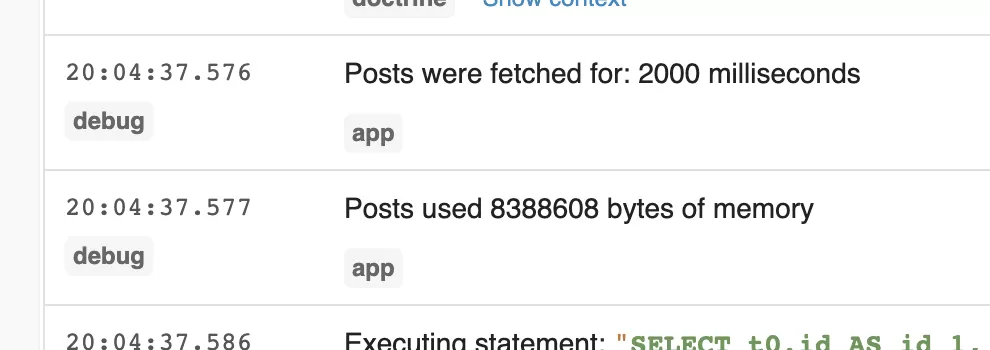
$logger->debug(sprintf('Posts were fetched for: %s milliseconds', $event->getDuration()));
$logger->debug(sprintf('Posts used %s bytes of memory', $event->getMemory()));
// ..
}
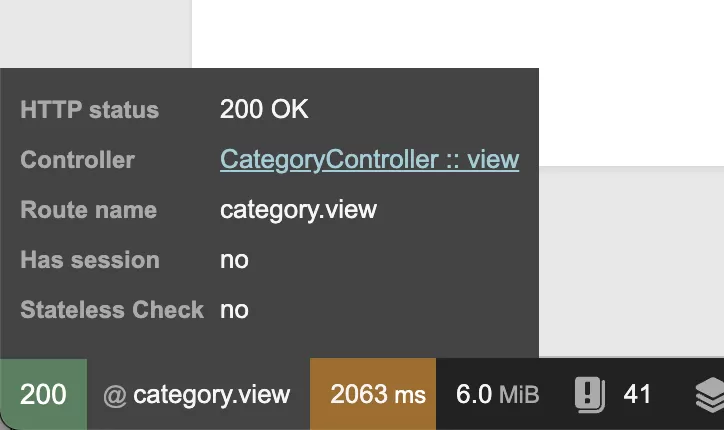
Navigate to Symfony Profiler (by clicking on the bottom left)
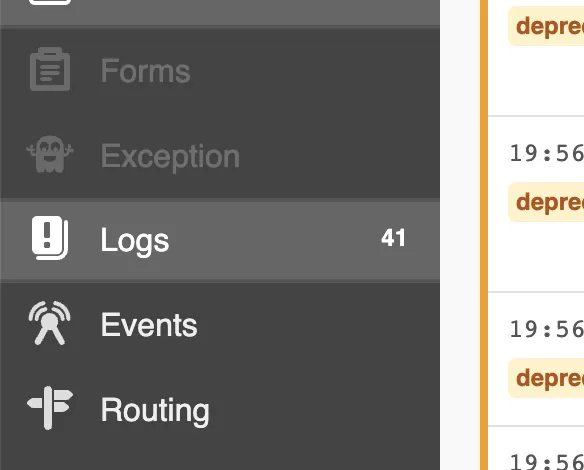
Then navigate to Logs
Click on All messages and the filter by debug level.
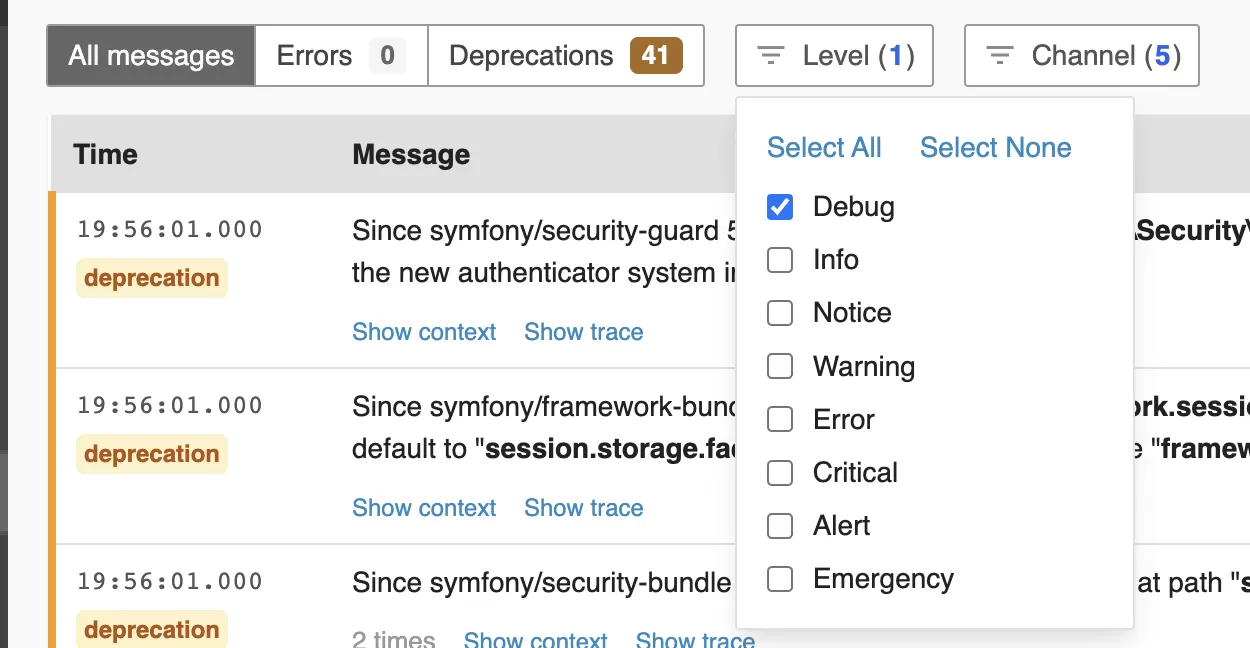
And you should see your debug logs containing the stopwatch information.